
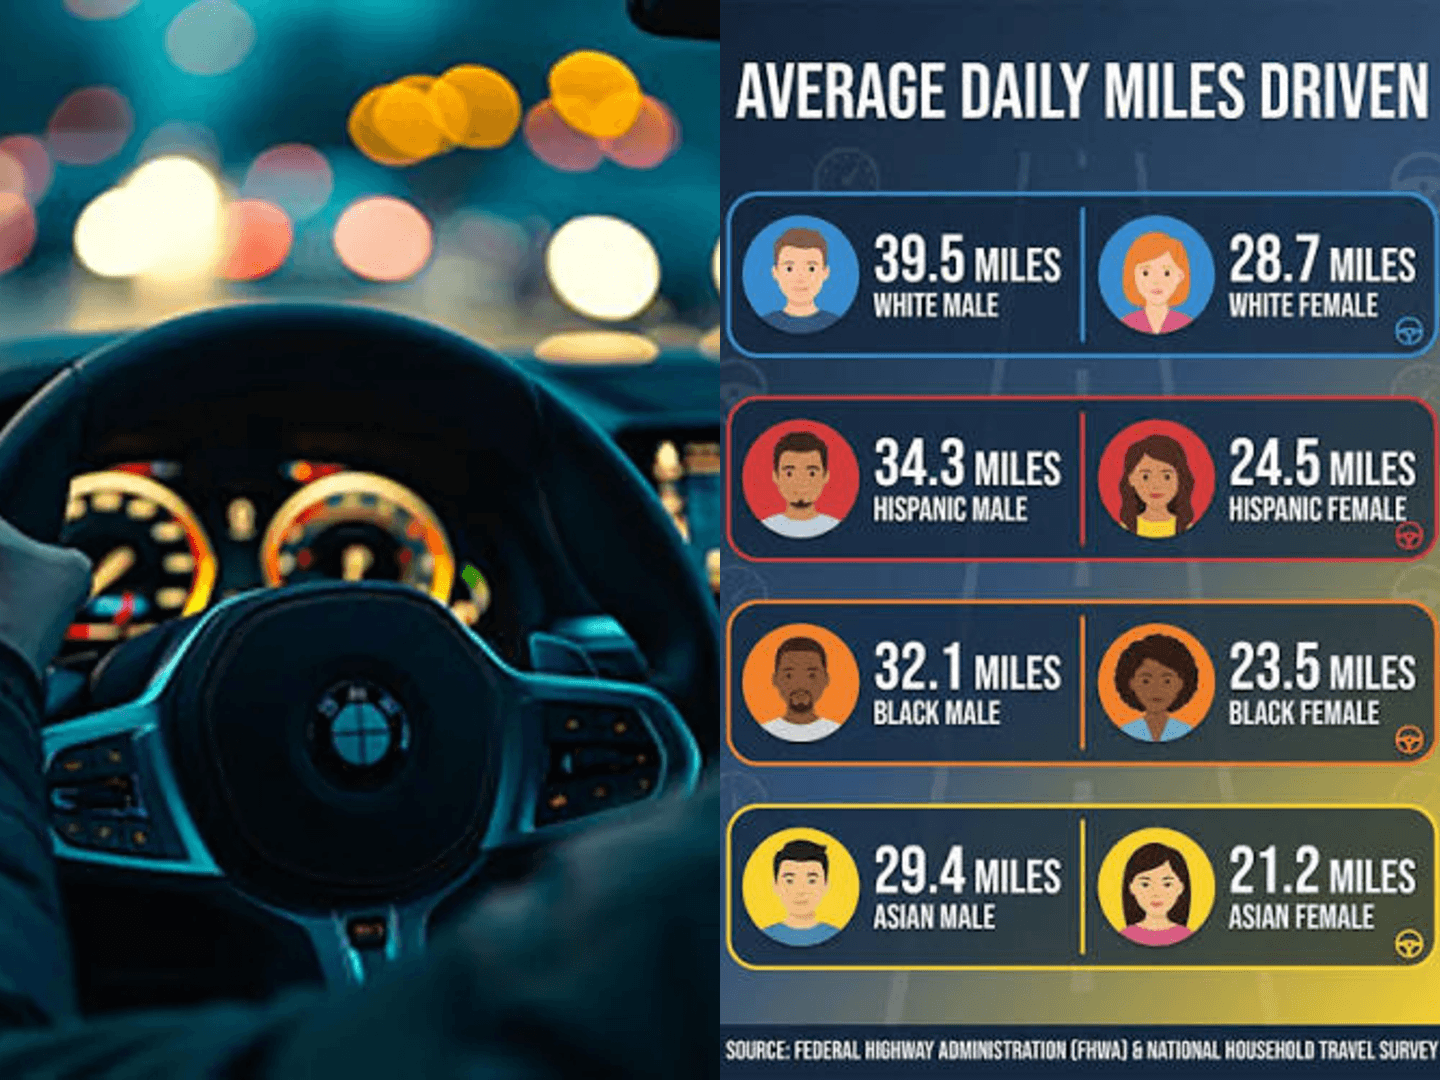
The average miles driven per year in the United States is 13,476 miles per driver, according to the Federal Highway Administration. That figure translates to roughly 37 miles every day. It sits at the center of a surprisingly wide range shaped by age, gender, geography, and the type of vehicle sitting in your driveway.
That number matters more than most drivers realize. Insurance companies, leasing agents, and used car appraisers all rely on annual mileage to estimate risk and value. Understanding where you fall against the national average can directly affect what you pay and what your car is worth.
What Is the Average Miles Driven Per Year in the US?
The Federal Highway Administration reports an average of 13,476 miles per year per driver, based on data published in its Highway Statistics series. This is a per-driver figure, not a per-vehicle figure, and the distinction is important. A household with two drivers and one car will show lower per-vehicle mileage than a household with two drivers and two cars.
A separate 2025 study by iSeeCars analyzed odometer readings from over 2.1 million three-year-old vehicles and found the average gasoline-powered car is driven 13,323 miles per year. That estimate lands close to the FHWA figure, which reinforces the reliability of both sources.
Average Miles Driven Per Year by Age and Gender
Driving habits shift dramatically across a person’s lifetime. The FHWA breaks down annual mileage by both age and gender, and the pattern is clear: middle-aged men drive the most, while teenagers and seniors drive the least.
Drivers aged 35 to 54 log the highest annual mileage at 15,291 miles on average, with men in that group reaching 18,858 miles. Drivers aged 16 to 19 average just 7,624 miles, reflecting limited work commutes and restricted driving privileges in many states.
Gender differences are consistent across every age bracket. Men average 16,550 miles per year, while women average 10,142 miles, a gap of more than 6,000 miles. The FHWA data shows this gap persists from the teenage years through retirement.
Average Miles Driven Per Year by Vehicle Type
The type of powertrain under the hood influences how much a vehicle gets used, and the results may surprise you. According to the iSeeCars 2025 study, conventional hybrids are driven the most at 14,696 miles per year, which is 10.3% more than the average gasoline vehicle.
Plug-in hybrids sit at the bottom with 11,660 miles per year, while fully electric vehicles average 11,880 miles. Gasoline vehicles fall in the middle at 13,323 miles. The low EV average comes with a major exception: the Tesla Model 3 and Model Y are driven 13,759 and 13,538 miles per year respectively, both exceeding the gas-car average.
iSeeCars Executive Analyst Karl Brauer noted, “Hybrids being driven more than gasoline models shows how far the technology has advanced.” That observation reflects how hybrids have moved from niche experimental vehicles to mainstream commuter choices.
Which Cars Get Driven the Most and Least?
Vehicle purpose drives mileage more than any other factor. Family haulers dominate the high-mileage end of the spectrum, while sports cars occupy the opposite extreme.
The Chrysler Pacifica minivan leads all gasoline vehicles at 20,872 miles per year, which is 56.7% above the gas-vehicle average. The Chrysler Voyager follows at 20,549 miles, and the Chevrolet Suburban rounds out the top three at 19,626 miles. The Kia Carnival and Chevrolet Malibu complete the top five, all exceeding 18,800 miles annually.
At the other end, the Ford Mustang is the least-driven car in America at just 2,092 miles per year, a staggering 84.3% below the gas average. The Mercedes-Benz SL-Class averages 3,176 miles, the Porsche 911 sits at 3,850 miles, and the Chevrolet Corvette manages 4,394 miles. These cars are typically weekend toys, not daily commuters.
Average Miles Driven Per Year by State
Geography creates some of the widest mileage variations in the country. The FHWA’s 2023 Highway Statistics data reveals a range of more than 10,000 miles per capita between the highest and lowest states.
Wyoming tops the list at 16,501 miles per capita, followed by Mississippi at 13,827 miles and Missouri at 13,132 miles. These states share characteristics like lower population density, longer distances between services, and limited public transit options.
The District of Columbia records the lowest figure at just 5,048 miles per capita, reflecting its compact geography and extensive transit network. New York follows at 5,944 miles, and Rhode Island sits at 6,893 miles. Dense urban states with robust public transportation consistently show lower per-capita driving.
| Field | Information |
|---|---|
| Full Name | Karl Brauer |
| Profession | Executive Analyst, iSeeCars.com; Automotive Journalist; Forbes Contributor |
| Education | University of Colorado Boulder |
| Years Active | Over 25 years in automotive publishing |
| Notable Roles | Editor-in-Chief, Edmunds.com; Executive Publisher, Autotrader and Kelley Blue Book |
| Current Position | Executive Analyst at iSeeCars.com (joined 2020) |
| Notable Works | iSeeCars industry studies on vehicle pricing, depreciation, and sales trends |
| Awards / Juries | Juror and Board Member, North American Car and Truck of the Year |
| Media Appearances | CNN, The New York Times, Good Morning America, Bloomberg, BBC |
| YouTube Channel | Karl Brauer Cars |
| Social Media (X) | @karlbrauer |
| Website | karlbrauer.com |
Note on Unavailable Fields: Age, birthplace, height, net worth, and spouse or partner information could not be verified from the search results and are therefore excluded.
Why Your Mileage Might Be Higher or Lower Than Average
Daily commuting remains the single largest contributor to annual mileage for most drivers. A worker with a 30-mile round-trip commute drives roughly 7,500 miles per year just getting to and from the office, before accounting for errands, school pickups, or weekend trips.
Remote and hybrid work arrangements have reshaped these patterns. A driver who once commuted five days a week may now drive half that distance, which explains why some households have seen annual mileage drop by thousands of miles since 2020.
Vehicle purpose also plays a decisive role. A minivan used for family hauling, carpooling, and road trips will naturally accumulate far more miles than a convertible stored in a garage for sunny weekends. The iSeeCars data confirms that function, not price, predicts mileage most accurately.
Why Average Mileage Matters
Insurance companies treat annual mileage as a core risk factor. Drivers who log 15,000 miles or more per year typically pay higher premiums than low-mileage drivers, because more time on the road statistically increases accident exposure.
Leasing contracts almost always include mileage caps, commonly set between 10,000 and 15,000 miles per year. Exceeding those limits triggers per-mile penalties that can quickly add up. A driver who averages 18,000 miles annually on a 12,000-mile lease faces substantial end-of-term charges.
Resale value also hinges on mileage. The 15,000-mile-per-year benchmark remains a standard reference point in vehicle valuation guides. A three-year-old car with 60,000 miles will appraise higher than an identical model with 75,000 miles, even if both are mechanically sound.
How to Calculate Your Own Average Miles Per Year
Your personal average is easy to estimate with basic odometer readings. Check your current mileage, then compare it to a reading from one year ago. If you do not have an exact date, use any service record, inspection report, or oil change receipt with an odometer notation.
Subtract the earlier figure from the current one. The result is your annual mileage. If you have data covering only six months, double the difference to approximate a full year. This simple calculation gives you a reliable baseline for insurance quotes, lease planning, or resale preparation.
Frequently Asked Questions
Is 15,000 miles a year a lot? It sits slightly above the national average of 13,476 miles but remains normal for commuters and families. Many leases consider 15,000 miles the upper threshold before penalties apply.
What is the average miles driven per year for a car? Gasoline vehicles average 13,323 miles annually, according to iSeeCars. Hybrids exceed that figure at 14,696 miles, while EVs average 11,880 miles.
Which state drives the most? Wyoming leads with 16,501 miles per capita, followed by Mississippi and Missouri. The District of Columbia records the lowest at 5,048 miles.
The Bottom Line
The national average of 13,476 miles per year provides a useful benchmark, but “normal” depends heavily on who you are and what you drive. A middle-aged male commuter in Wyoming with a minivan will blow past that figure, while a retired woman in New York with a sports car may drive a fraction of it.
Calculating your own annual mileage takes five minutes and can inform smarter decisions about insurance, leasing, and resale. As remote work reshapes commuting patterns and hybrids outsell pure EVs in annual usage, the national average may shift in the years ahead. For now, 13,476 miles remains the number to beat.
